Given the following sampling distribution of a mean from a normally distributed population with a...
Question:
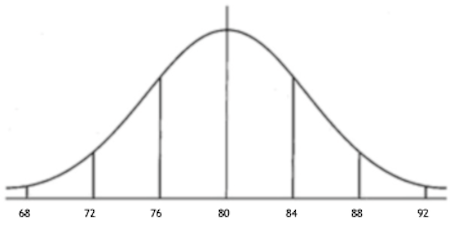
Given the following sampling distribution of a mean from a normally distributed population with a standard deviation of 12, find the sample size, n.
 |
Standard Error:
In statistics, standard error indicated how much the sample mean is different from the population mean. The standard error (SE) of a statistic is the standard deviation of its sampling distribution or an estimate of that standard deviation. The standard error is given by the formula:
{eq}SE = \frac{\sigma}{\sqrt{n}} {/eq}
where,
{eq}\sigma {/eq} = standard deviation
{eq}n = {/eq} sample size
Answer and Explanation: 1
Become a Study.com member to unlock this answer! Create your account
View this answerGiven:
{eq}\sigma = 12 {/eq}
For the question in which the graph is given, the mean can easily be found out as the mean is mid of the...
See full answer below.
Ask a question
Our experts can answer your tough homework and study questions.
Ask a question Ask a questionSearch Answers
Learn more about this topic:

from
Chapter 7 / Lesson 13Understand the standard error of the mean and how to find the mean of the sampling distribution. Learn to find the standard error of the mean and its uses.
Related to this Question
- Given the following hypotheses: H_0 : \mu = 400 H1 : \mu \ne 400. A random sample of 12 observations is selected from a normal population. The sample mean was 407 and the sample standard deviation 6
- A population has a mean of 150 and a standard deviation of 27. Find the mean and standard deviation of the sampling distribution of sample means with a sample size of n=58.
- Use the range rule of thumb to estimate the standard deviation for the following sample (not population) data. -1, -1, -8, -5, 10, 9, -3, -2, 10 The standard deviation is approximately _______.
- A random sample of size 36 is to be taken from a population that is normally distributed with a mean of 48 and a standard deviation of 12. The sampling distribution of the mean is: a. non-normal with a mean of 48 and a standard deviation of 12 b. normal w
- Given the following data: 36, 64, 18, 40, 35, 30, 41, 32 The mean is 37. What is the population standard deviation?
- Given the observed sample mean of 9.2, sample standard deviation 6.7, and sample size 315, find the P-value for this test of the population mean.
- Random samples of size 17 are taken from a population that has 200 elements, a mean of 36, and a standard deviation of 8. The mean and the standard deviation of the sampling distribution of the sample means are a) 8.7 and 1.94 b) 36 and 1.94 c) 36 and
- Suppose that a random sample of size 64 is to be selected from a population with mean 40 and a standard deviation 5. What is the mean of the x-bar sampling distribution?
- A random sample of 100 observations from a population with standard deviation 14.69 yielded a sample
- Samples of size 25 are selected from a population with mean 40 and standard deviation 7.5. The standard error of the sampling distribution of sample means is _.
- A sample of size 126 will be drawn from a population with mean 26 and standard deviation 3. a. Find the probability that x will be between 25 and 27. b. Find the 55th percentile of x.
- Assume that a population is normally distributed with a mean of 100 and a standard deviation of 15. Would it be unusual for the mean of a sample of 3 to be 115 or more?
- A random sample of size 15 is selected from a normal population. The population standard deviation is
- The results of randomly sampling two independent populations: Sample 1 from Population 1 Sample 2 from Population 2 sample mean 1, 000 1,250 sample standard deviation 400 500 sample size 50 75 Test the hypothesis: H_0: Population 1 mean} = Population 2 me
- Suppose x has a distribution with a mean of 70 and a standard deviation of 51. Random samples of size n = 36 are drawn. a. Compute the mean and standard deviation of the xbar distribution. b. Find the z-value corresponding to xbar = 53. c. Find P(xbar les
- Given the following data: 36, 64, 18, 40, 35, 30, 41, 32 The mean is 37. What is the sample standard deviation?
- A random sample is taken and the sample size is 25. The sample is normally distributed, the sample mean is 89, and the standard deviation is 5.5. Find a 90% confidence interval for the population mean. (a) 78.69 to 98.34 (b) 88.56 to 89.16 (c) 88.21 to
- A population of values has a normal distribution with mean = 11.9 and standard deviation = 51.5. You intend to draw a random sample of size n = 24. What is the standard deviation of the distribution of sample means?
- A sample of 49 observations is taken from a normal population with a standard deviation of 10. The sample mean
- A population has a mean µ = 135 and a standard deviation σ = 29. Find the mean and standard deviation of the sampling distribution of sample means with sample size n = 57. The mean is \mu_x = ___, and the stated deviation is \sigma_x = _____.
- A population is normally distributed with a mean of 65 and a standard deviation of 12. a) What is the mean of the sampling distribution (muM) for this population? b) If a sample of 36 participants is selected from this population, what is the standard err
- Assuming the population is normally distributed, test the claim that the mean is more than 23 using a significance level of 0.05. The sample statistics are a mean of 24.9, a standard deviation of 2.11, and a sample size of 9. a. The data do not support th
- Given the following data: 36, 64, 18, 40, 35, 30, 41, 32 The mean is 37. What is the population variance?
- A sample of 100 observations is taken from a normal population with a standard deviation of 10. The sample mean is 1000. Determine the 99% confidence interval for the population mean.
- Which of the following is true about the sampling distribution of the sample mean of a random sample? Select one or more: a. It is always normally distributed, regardless of sample size. b. As the sample size grows larger, the sample mean will be more lik
- A population of values has a normal distribution with mean 46.7 and standard deviation 97. You intend to draw a random sample of size n= 61. a) What is the mean of the distribution of sample means? b)
- Let x be a continuous random variable that has a normal distribution with mean = 60 and standard deviation = 14. Assuming n <= 0.05N, where n = sample size and N = population size, find the probability that the sample mean x, for a random sample of 24 tak
- An unknown distribution has a mean of 80 and a standard deviation of 12. A sample size of 95 is drawn randomly from the population. Find the sum that is two standard deviations above the mean of the sums: A) 7500.00 B) 7777.77 C) 6434.78 D) 7833.92 E) 897
- If the standard deviation of a random variable X is 15 and a random sample of size n equals 19 is obtained, what is the standard deviation of the sampling distribution of the sample mean?
- An unknown distribution has a mean of 80 and a standard deviation of 12. A sample size of 95 is drawn randomly from the population. Find the probability that the sum of the 95 values is greater than 7,650. 0.3345 0.8643 0.9876 0.9999 0.1786
- A sample size of 76 yields a sample mean of 80 and a sample standard deviation of 1.5. Test the claim that the population mean is less than or equal to 85 at 0.01.
- A population has a mean of 150 and a standard deviation of 16. a) What are the mean and standard deviation of the sampling distribution of the mean for N = 25? b) What are the mean and standard deviation of the sampling distribution of the mean for N = 50
- A population has a mean of 50 and a standard deviation of 6. (a) What are the mean and standard deviation of the sampling distribution of the mean for N = 16? (b) What are the mean and standard deviation of the sampling distribution of the mean for N =
- A random sample of size 81 is taken from a normal population having a mean of 80 and a standard deviation of 4. A second random sample of size 64 is taken from a different normal population having a mean of 65 and a standard deviation of 7. Find the proba
- Use the sample results below to approximate the margin of error and a 95% confidence interval for the population mean. Sample size = 1,053 Sample mean = $46,234 Sample standard deviation = $23,000
- Suppose that 32% of a population owns a computer. A random sample of 80 individuals will be chosen. a) Find the mean and standard deviation of the sampling distribution for samples of size 80 chosen from this population.
- Samples of n = 36 scores are selected from a population. If the distribution of sample means has an expected value of Mean = 30 and a standard error of Mean = 4, what is the mean and the standard deviation (SD) for the population? a. mean=30 and SD=24 b
- A sample of size 60 will be drawn from a population with mean 25 and standard deviation 6. Find the probability that x will be less than 26.
- A population has a mean of 62 and a standard deviation of 10. If a random sample of 49 observations is obtained, what is the probability that the sample mean is each of the following: a. Greater than 61.3 b. Less than 60.5 c. Less than 63.4 d. Between
- Find the sample standard deviation for the following data set: 23 27 12 17 16
- A random sample is obtained from a normal population with a mean of 95 and a standard deviation of 40. The sample mean is 86. a. Is this a representative sample mean or an extreme value for a sample of n = 16 scores? b. Is this a representative sample mea
- A random sample of 14 observations from a normally-distributed population produces = 1.4 and s = 2. Find a 90% confidence interval for the population standard deviation.
- A random sample of 15 observations from a normally-distributed population produces x = 1.5 and s = 3. Find a 96% confidence interval for the population standard deviation.
- A random variable is normally distributed, with a mean of 14 and a standard deviation of 3. For a sample of size 10, what can be said about the shape of the sampling distribution of the sample mean? State the mean and standard deviation of the sampling di
- A simple random sample of size n = 180 is obtained from a population whose size = 20,000 and whose population proportion with a specified characteristic is p = 0.45. Determine whether the sampling distribution has an approximate normal distribution.
- Find the range and the standard deviation of the following sample: 84.26 84.67 85.18 85.55 84.86 85.56 84.91 85.02 85.01
- Find the standard deviation of the following sample: -4, -1, -1, -4, -20, 7.
- A population of values has a normal distribution with \mu= 43.9 and \sigma= 62.9. If you intend to draw a random sample of size n = 94, what is the mean of the distribution of sample means?
- Suppose that a random sample of size 36 is drawn from a population with a mean of 274. If 87% of the time the sample mean is less than 278, what is the population standard deviation?
- Suppose a random sample of size 36 is drawn from a population with a mean of 275. If 86% of the time the sample mean is less than 279, what is the population standard deviation?
- Suppose that x has a distribution with mu=9 and sigma=4. If a random sample is taken of size n = 49, find the standard deviation.
- Assume that a sample is used to estimate a population mean. Find the margin error, M.E. that corresponds to a sample size of 22 with a mean of 49.4 and a standard deviation of 10.7 at a confidence level of 95%.
- A population has a mean of 84, and a standard deviation of 12. A sample of 36 observation will be taken. What's the probability that the sample mean will be between 80.54 and 88.9?
- All random samples of size n = 9 are selected from a normal population with \mu = 55 and \sigma = 10, and the mean is computed for each sample. Then, all the possible samples of size n = 36 are selected from the same population, and the mean is computed f
- A population of values has a normal distribution with standard deviation 8.8 and mean 70.3. You intend to draw a random sample of size n=14. Find the probability that a single randomly selected valu
- A population has a mean of 300 and a standard deviation of 18. A sample of 144 observations will be taken. What is the probability that the sample mean will be between 297 to 303?
- The results of sampling independent populations: Sample 1 Sample 2 (from Population 1) (from Population 2) Sample Mean (overline{x}) 40 55 Population variance} (sigma^2) 5 3 Sample size (n) 35 100 Test the claim Population 1 mean is greater than Populatio
- A population has a mean of 55 and a standard deviation of 9. If a random sample of 37 is taken, what is the probability that the sample mean is each of the following? A) Greater than 56.3 B) Less than 57.5 C) Less than 53.9 D) Between 54.2 and 57.0 E
- A sample of size 42 will be drawn from a population with a mean of 52 & standard deviation of 9. a) Is it appropriate to use the normal distribution to find properties for ''x''? b) If appropriate, find the probability that ''x'' will be between 53 & 54
- A normal population has a mean of $76 and a standard deviation of $17. You select random samples of nine. What is the probability that the sampling error (x) would be $9 or more? That is, what is the probability that the estimate of the population mean is
- A random sample of 144 observations has a mean of 20, a median of 21, and a mode of 22. The population standard deviation is known to equal 4.8. The 95.44% confidence interval for the population mean is \\ Group of answer choices
- Consider a large population with p = 0.24. Find the mean and standard deviation of the sample proportion for a sample size of n = 490. Round your answer for standard deviation to three decimal places.
- Find the mean, the variance, and the standard deviation of the following data: 75 76 72 66 72 64 72
- Given a test that is normally distributed with a mean of 100 and a standard deviation of 15, find: a) the probability that a sample of 73 scores will have a mean greater than 107. b) the probability that the mean of a sample of 13 scores will be either le
- How large a sample should be taken if the population mean is to be estimated with 99% confidence to within $70? The population has a standard deviation of $890.
- A random sample is selected from a normal population with a mean of \mu = 30 and a standard deviation \sigma = 8 . After a treatment is administered to the individuals in the sample, the sample mean is found to be M = 33 . If the sample consists of n =
- A population of values has a normal distribution with mu = 124.6 and sigma = 18.8. You intend to draw a random sample of size n = 109. a. What is the mean of the distribution of sample means? b. What is the standard deviation of the distribution of sample
- A simple random sample of size n is drawn from a population that is normally distributed. The sample mean is found to be 105, and the sample standard deviation is found to be 10. (a) Construct a 96% confidence interval about mu if the sample size, n, is 1
- A population of values has a normal distribution with mu = 174.9 and sigma = 19. You intend to draw a random sample of size n = 138. a. What is the mean of the distribution of sample means? b. What is the standard deviation of the distribution of sample m
- For a population with a normal distribution, a mean of 22.5, and a standard deviation of 2.1, what values does 68% of the population lie between?
- The sampling distribution of the sample mean is shown. If the sample size is n=9, what is the standard deviation of the population from which the sample was drawn? Round to the nearest thousandth wher
- A population of values has a normal distribution with mu = 237.1 and sigma = 99.8. You intend to draw a random sample of size n = 69. a) What is the mean of the distribution of sample means? mu_overline{x} = _______ b) What is the standard deviation of th
- Let X 1 , , X n be independently and identically distributed samples from a population with mean and variance 2 . Suppose the sample size n is large. Find an approximate 1 confidence interval for .
- Suppose you have selected a random sample of n = 3 measurements from a normal distribution. Compare the standard normal z values with the corresponding t values if you were forming the following confidence intervals. (a) 99% confidence interval. (b) 95% c
- For the standard normal distribution, find the percentage of data that are more than 1 standard deviation away from the mean: A. 31.74% B. 66.26% C. 15.8%
- A random sample of 14 items is drawn from a population whose standard deviation is unknown. The sample mean is x = 780, and the sample standard deviation is s = 5. (a) Construct an interval estimate of with 98% confidence. (Round your answers to 3 decim
- Given a normal distribution, the population mean is 65 and the standard deviation is 8. What area of the normal distribution corresponds to a score below 50?
- Find the standard error of the mean for each sampling situation (assuming a normal population).
- A random sample of 14 items is drawn from a population whose standard deviation is unknown. The sample mean is \overline{x} = 780 and the sample standard deviation is \sigma = 5 . Find the t value. (a) Construct an interval estimate of
- If many samples of size 15 (that is, each sample consists of 15 items) were taken from a large normal population with a mean of 18 and variance of 5, what would be the mean, variance, standard deviation and shape of the distribution of sample means?
- Consider a normal distribution with a population mean of 65 and a standard deviation of 8. What area of the normal distribution corresponds to a score below 73?
- A random sample of 14 items is drawn from a population whose standard deviation is unknown. The sample mean is overline{x} = 780 and the sample standard deviation is s = 5. Construct an interval estimate of overline{x} with 98% confidence.
- Given a sample size of 36, how large does the population standard deviation have to be in order for the standard error to be (i) 1? (ii) 2? (iii) 5? (iv) 100?
- On average, what do we expect the sample mean to be equal to? a. 0 b. 42 c. population mean d. population standard deviation
- You are given the following information obtained from a random sample of five observations: 20, 18, 17, 22,18. At a 10% level of significance, use Excel to determine whether or not the mean of the population from which this sample was taken is significant
- A random sample of 66 observations was taken from a large population. The population proportion is 12%. What is the standard deviation of the proportion? What is the probability that the sample proportion will be more than 15%?
- Suppose a population proportion is .40, and 80% of the time when you draw a random sample from this population you get a sample proportion of .35 or more. How large a sample were you taking?
- Compute the variance and standard deviation for the following data samples. Sample 1. -1, 3, 3, 3 12 Sample 2. -9, 6, 3, 9, 0, 9
- For a normal population with \mu = 60 and \sigma = 50, the sampling distribution of sample means based on n = 25 will have an expected value of _____ and a standard error of _____. a. \mu_{M} = 12; \sigma_{M} = 10 b. \mu_{M} = 60; \sigma_{M} = 10 c. \mu_
- The standard error of M can never be greater than the standard deviation of the population from which the sample is selected.
- Below are the means of 12 samples (n = 40 for each sample) drawn at random from a population: 25.4 26.0 22.8 23.9 24.7 25.3 24.9 23.6 22.7 25.8 25.3 24.6 * From these sample means, calculate the best estimate for the population mean. * Calculate the s
- For a population with a mean of 75 and a standard deviation of 12, what proportion of sample means of size n = 16 fall above 82?
- A random sample of 26 items is drawn from a population whose standard deviation is unknown. The sample mean is \overline{x} = 860 and the sample standard deviation is s = 20. a. Construct an interval estimate of \mu with 95% confidence. Round your answer
- If many samples of size 100 (that is, each sample consists of 100 items) were taken from a large non-normal population with a mean of 10 and variance of 16, what would be the mean, variance, standard deviation and shape of the distribution of sample means
- What is the probability that the sample mean will be within 3 units of the population mean if the sample size is 36, the population mean is 50, and the population standard deviation is 10?
- A sample of n = 16 scores has a standard error of 4. What is the standard deviation of the population from which the sample was obtained?
- A random sample of 66 observations produces = -0.4 and s = 5.1. Find a 99% confidence interval for the population mean. Would this evidence suggest that any of the following are NOT the mean of the population? Select all that apply. A. -2.3 B. 1.7 C.
- From a normal distribution with a mean of 30 and a standard deviation of 20, a random sample of 100 was drawn. The mean of this sample was 26.5. An investigator thinks that the mean of the sample is different than the population mean. a. What is the null
- 1) The 16th percentile in a Normal distribution is 25 and 2.5% of the values in the distribution are greater than 40. Which of the following are best estimates for the mean and standard deviation of the distribution? (a) mean approximately 32.5, standard
- Given the following data: 32, 28, 25,16, 35, 42, 38 The mean is 30.8571. What is the standard deviation?